Premier League Analytics Notebook
Static export of a notebook-style walkthrough built from the Premier League project repository, using the real figures, metrics, and modelling structure from the codebase.
Premier League Predictive Analytics
A notebook-style walkthrough of the Premier League modelling project built from the real repository materials. This version focuses on the parts that matter most for a portfolio: data sources, feature pipeline, evaluation discipline, and season forecasting.
Project summary
- 15 Premier League seasons from 2010-11 to 2024-25
- Roughly 5,700 matches
- Three-class match prediction: Home / Draw / Away
- Benchmarked against Bet365 and Pinnacle implied probabilities
- Extended into league table forecasting with Dixon-Coles Monte Carlo simulation
The key point of the project is not that a model exists. It is that the evaluation is structured carefully enough to compare against the market without using unrealistic validation.
# Entry point and top-level pipeline stages
# From main.py

print('1. Load 15 seasons of match data + Elo ratings')
print('2. Engineer features: base, extended, and Pinnacle feature sets')
print('3. Train Logistic Regression, LightGBM, and Neural Network models')
print('4. Apply calibration, weighted ensembles, and stacked ensembles')
print('5. Blend model probabilities with bookmaker odds')
print('6. Evaluate with walk-forward testing and bootstrap significance tests')
print('7. Simulate full seasons with Dixon-Coles Monte Carlo')
Data sources
The repository combines several structured football data sources:
- match results and bookmaker odds from football-data.co.uk
- pre-season Elo ratings from ClubElo
- transfer spending aggregates
- expected goals data
- manager tenure information
This is useful because it shows more than basic match-level modelling. The pipeline is really a feature-integration problem before it becomes a model-comparison problem.
Feature pipeline
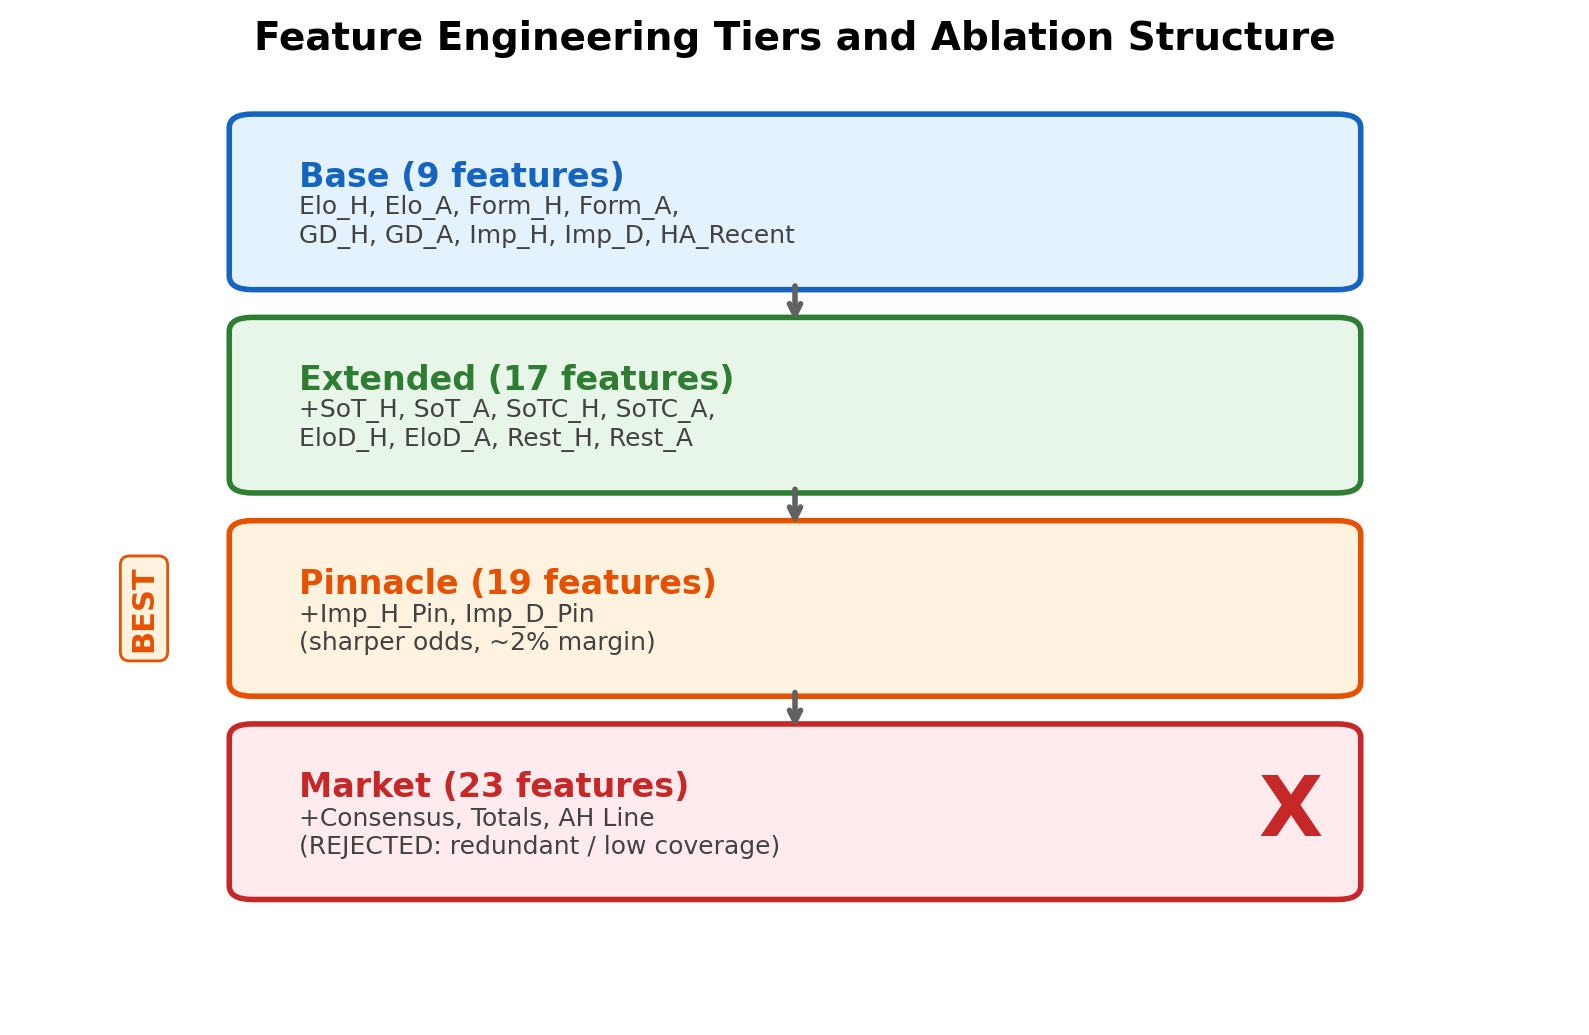
The pipeline engineers rolling form, goal difference, days rest, Elo momentum, shots on target, and implied-probability features. The repo also separates base, extended, Pinnacle, and market-driven feature sets so the effect of added information can be compared directly.
# Feature engineering sketch
# Adapted from src/features.py

FEATURE_IDEAS = [
    'Home_Form5 / Away_Form5',
    'Home_GD5 / Away_GD5',
    'Implied_Home / Implied_Draw / Implied_Away',
    'Days_Rest_Home / Days_Rest_Away',
    'Elo_Home_Delta / Elo_Away_Delta',
    'Home_SoT5 / Away_SoT5',
]

for feature in FEATURE_IDEAS:
    print(feature)
Walk-forward evaluation
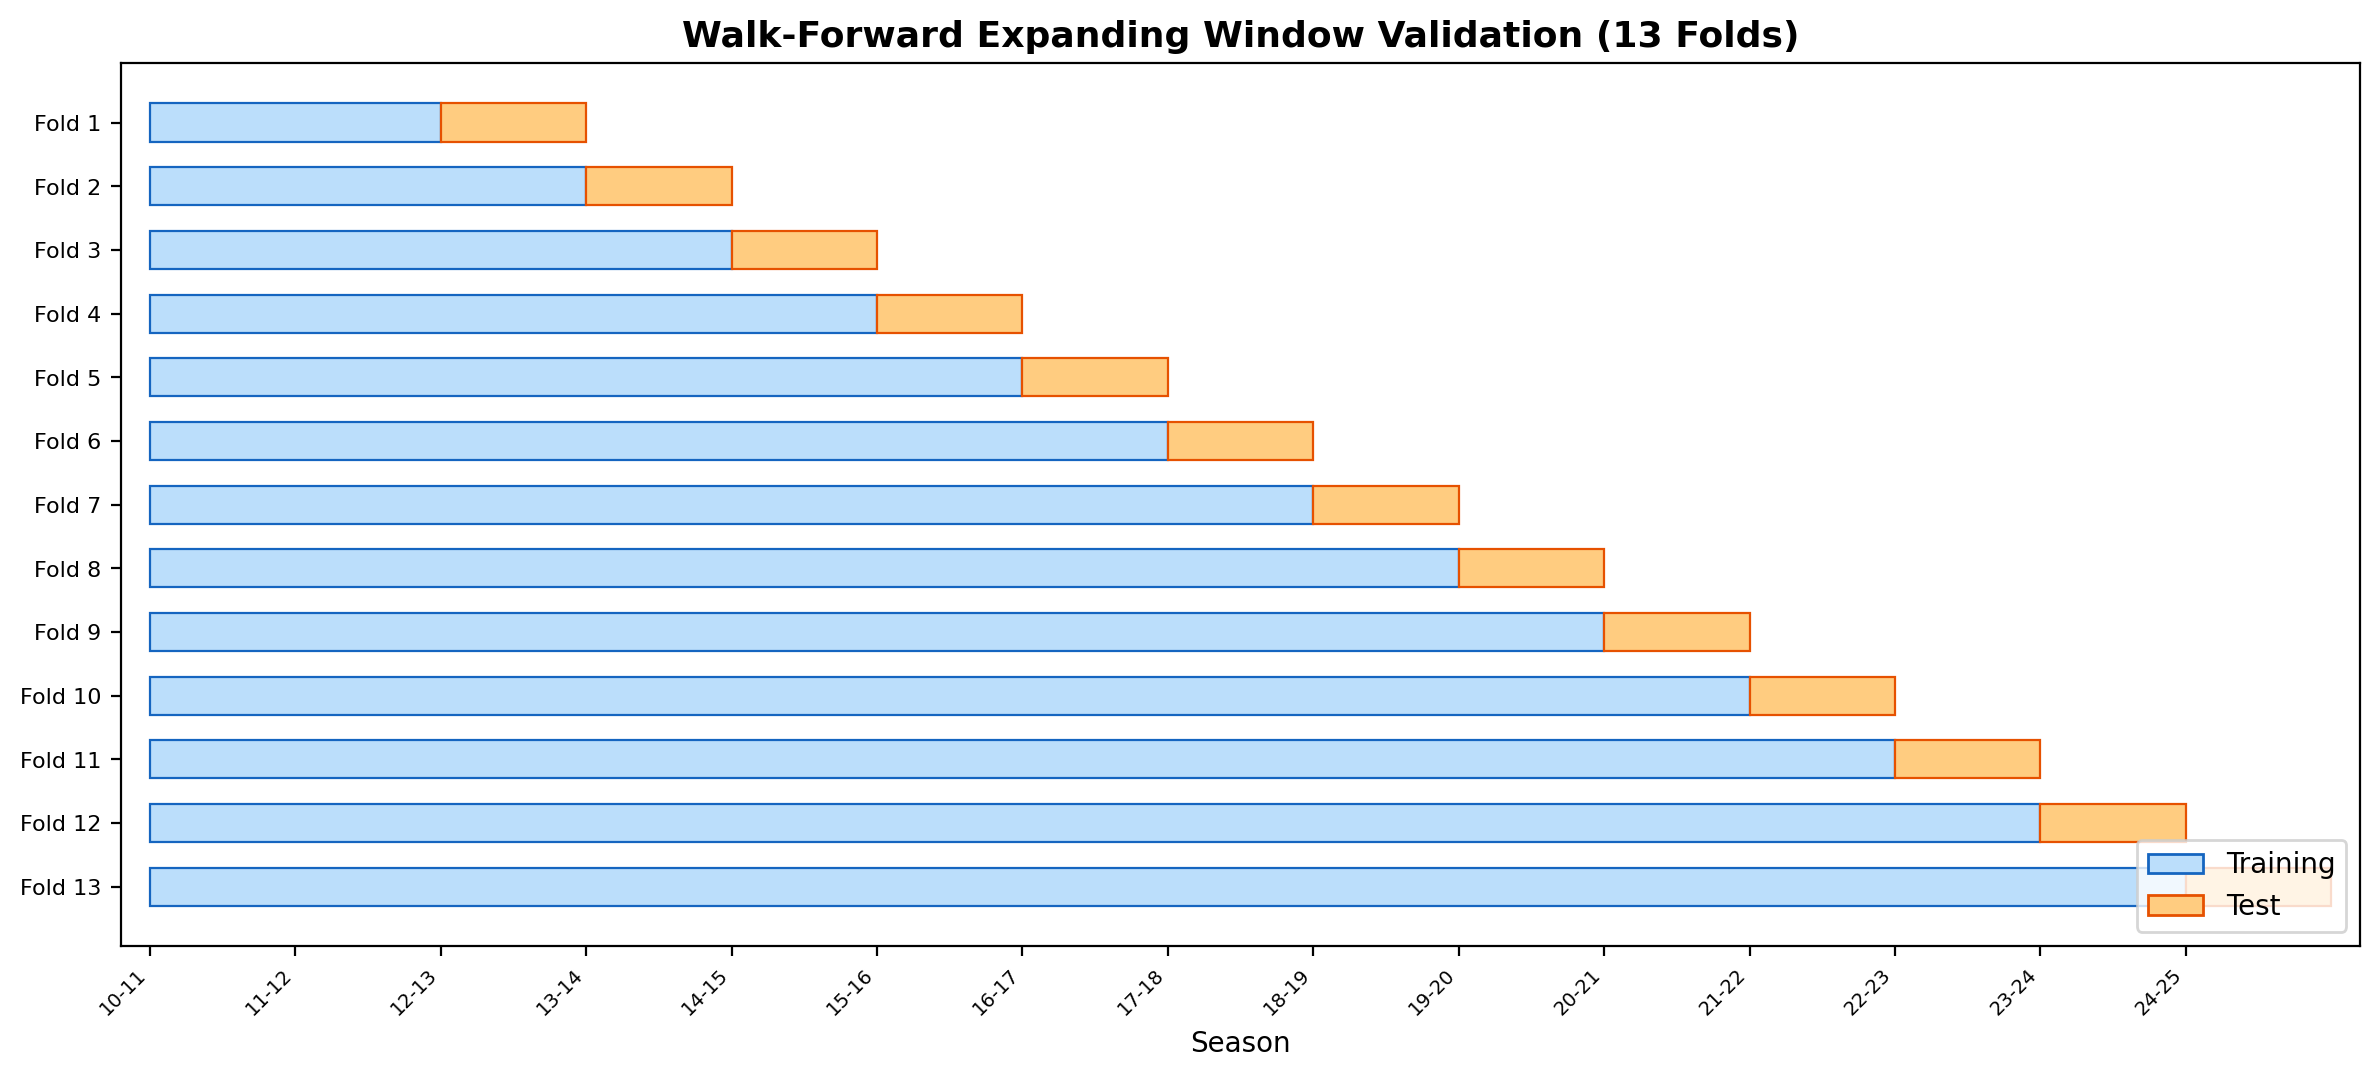
A strong part of the project is the expanding-window evaluation design. Instead of random train-test splits, each season is predicted using only information available up to that point. That makes the results much more defensible.
Key results
| Metric | Result | | --- | --- | | Best single model | Neural Network, 19 features, 0.9678 log-loss | | Bet365 benchmark | 0.9686 log-loss | | Pinnacle benchmark | 0.9682 log-loss | | Best blend | Neural Network 10% + Pinnacle 90%, p=0.007 vs Bet365 | | Position prediction | 6.7 of 20 exact positions via multi-target Ridge blend |
The most credible result here is not a sweeping “beat the market” claim. It is that selective blending and careful evaluation show where the model contributes incremental signal.
Metrics comparison
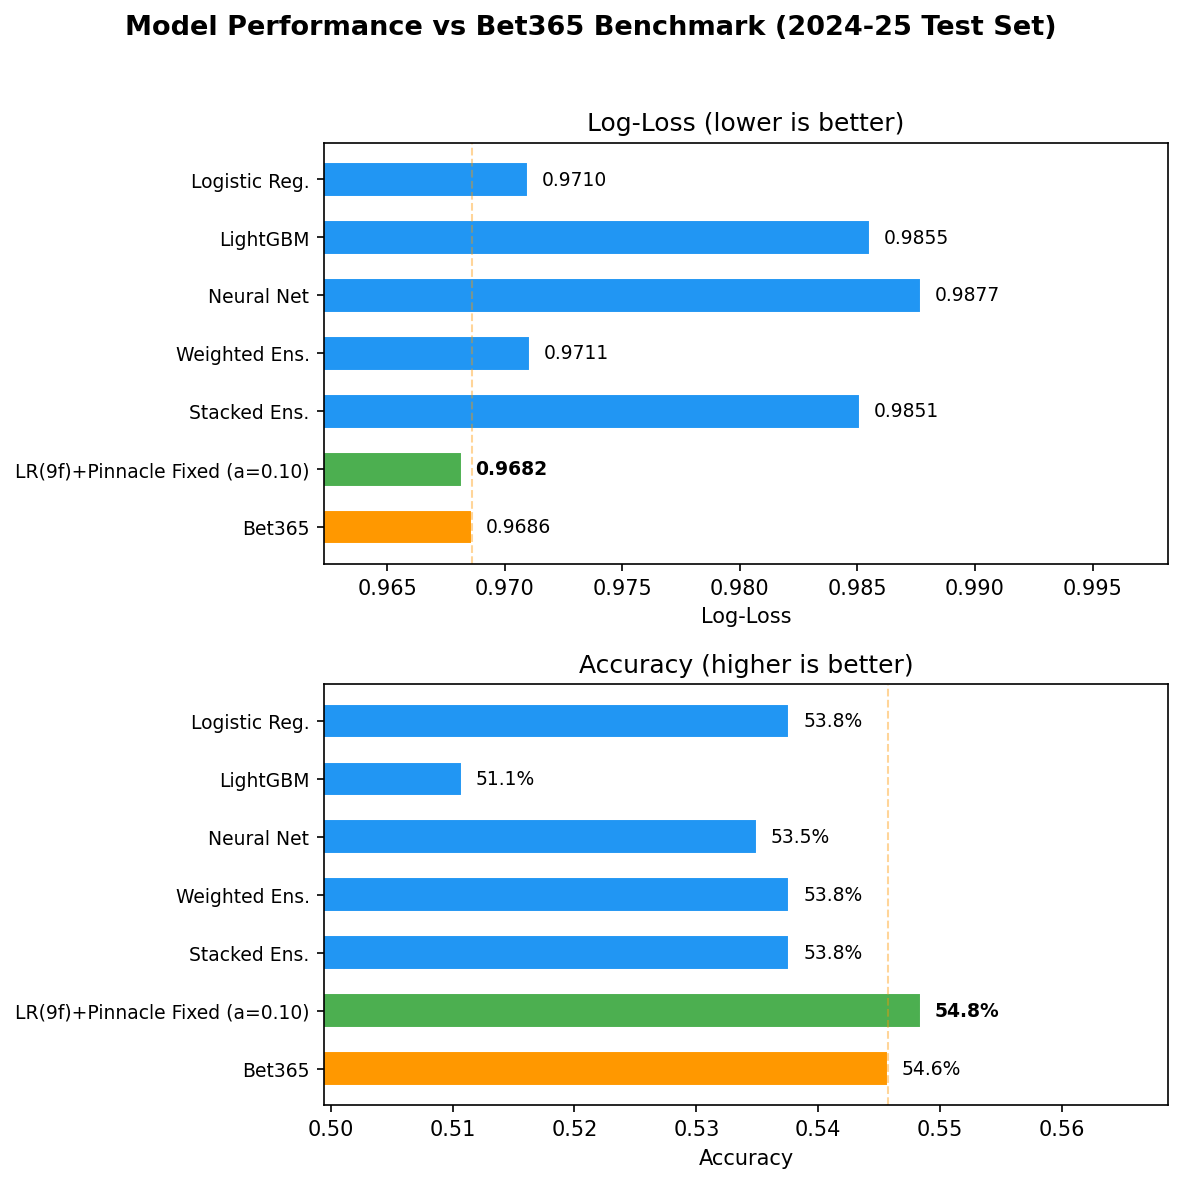
This comparison is useful because it keeps the model honest. The project does not stop at reporting a best internal score; it evaluates the predictive pipeline against the bookmaker market that practitioners would actually care about.
Calibration
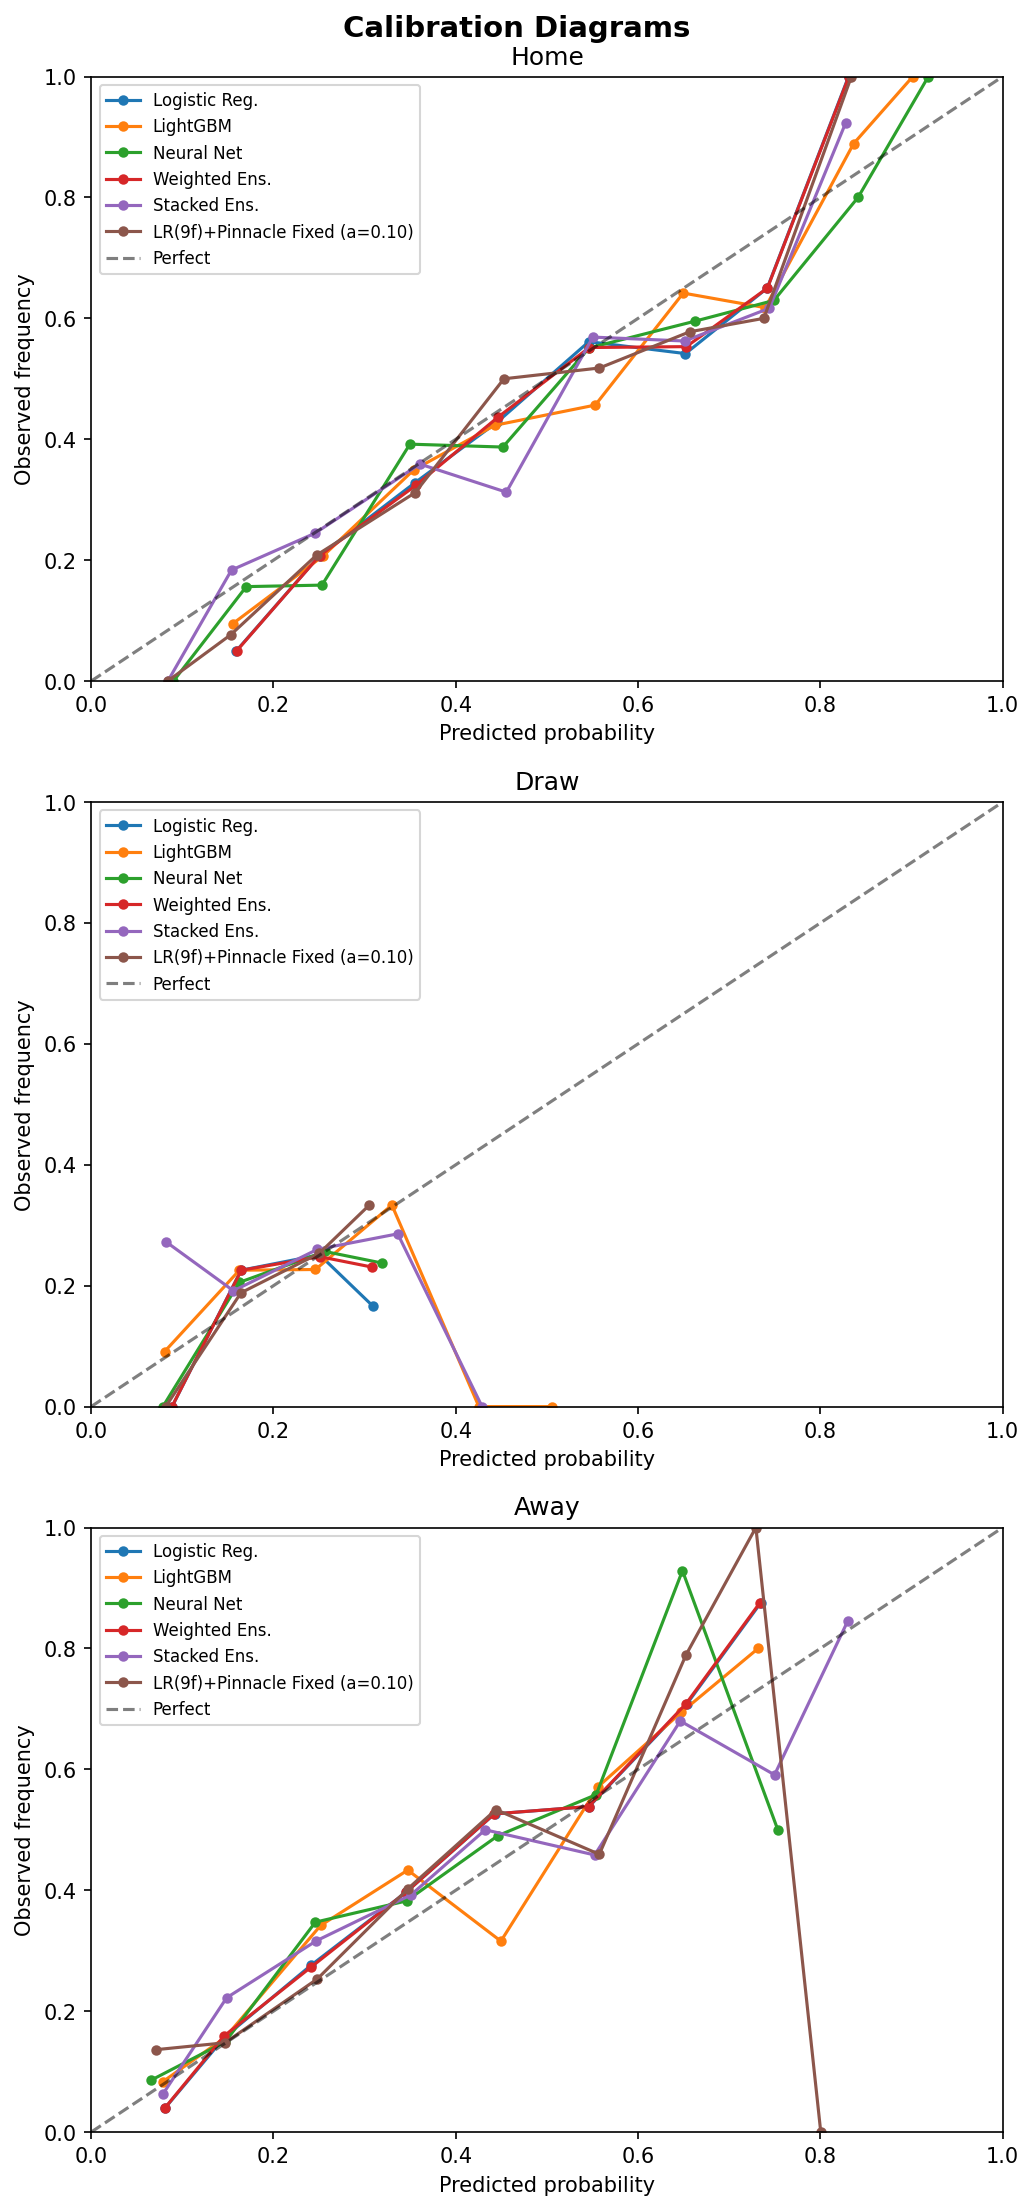
For a probability project, calibration matters at least as much as hard classification accuracy. The repo includes Platt scaling and blending logic so predicted probabilities can be judged on quality rather than just ranking.
Feature importance
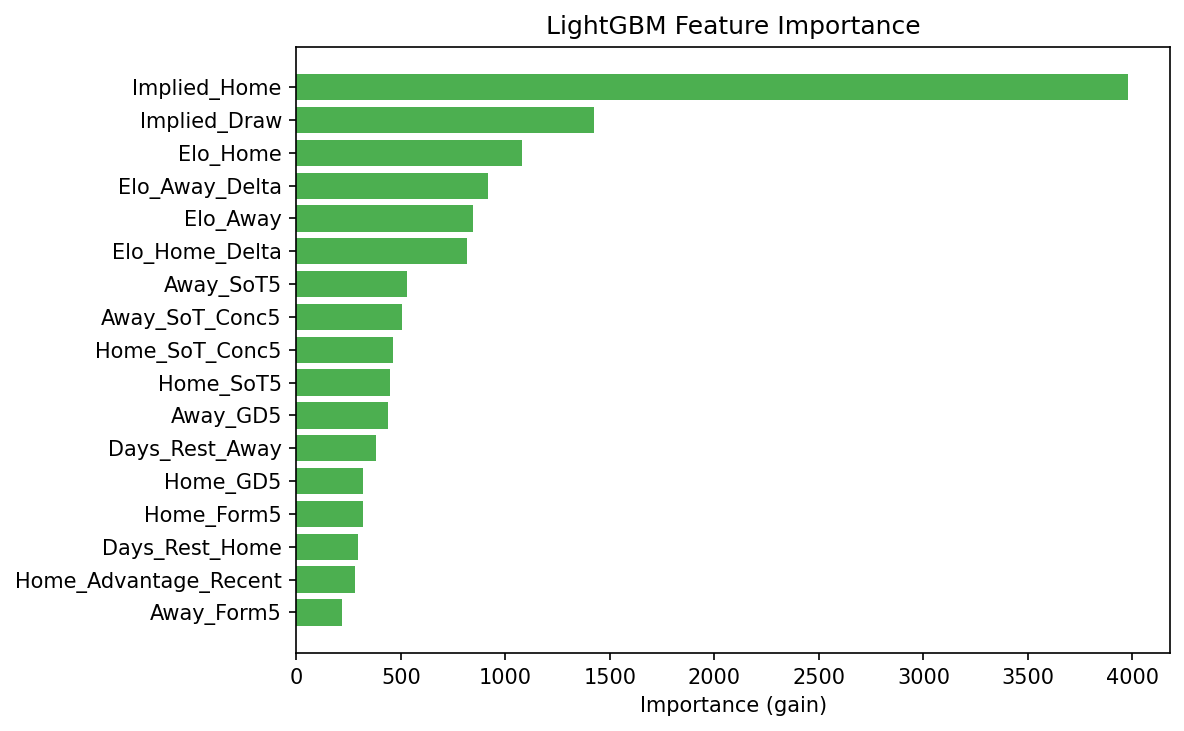
This is one of the stronger portfolio signals in the project: not just model fitting, but thoughtful feature design around form, Elo, shot quality, and bookmaker-implied information.
Season forecasting
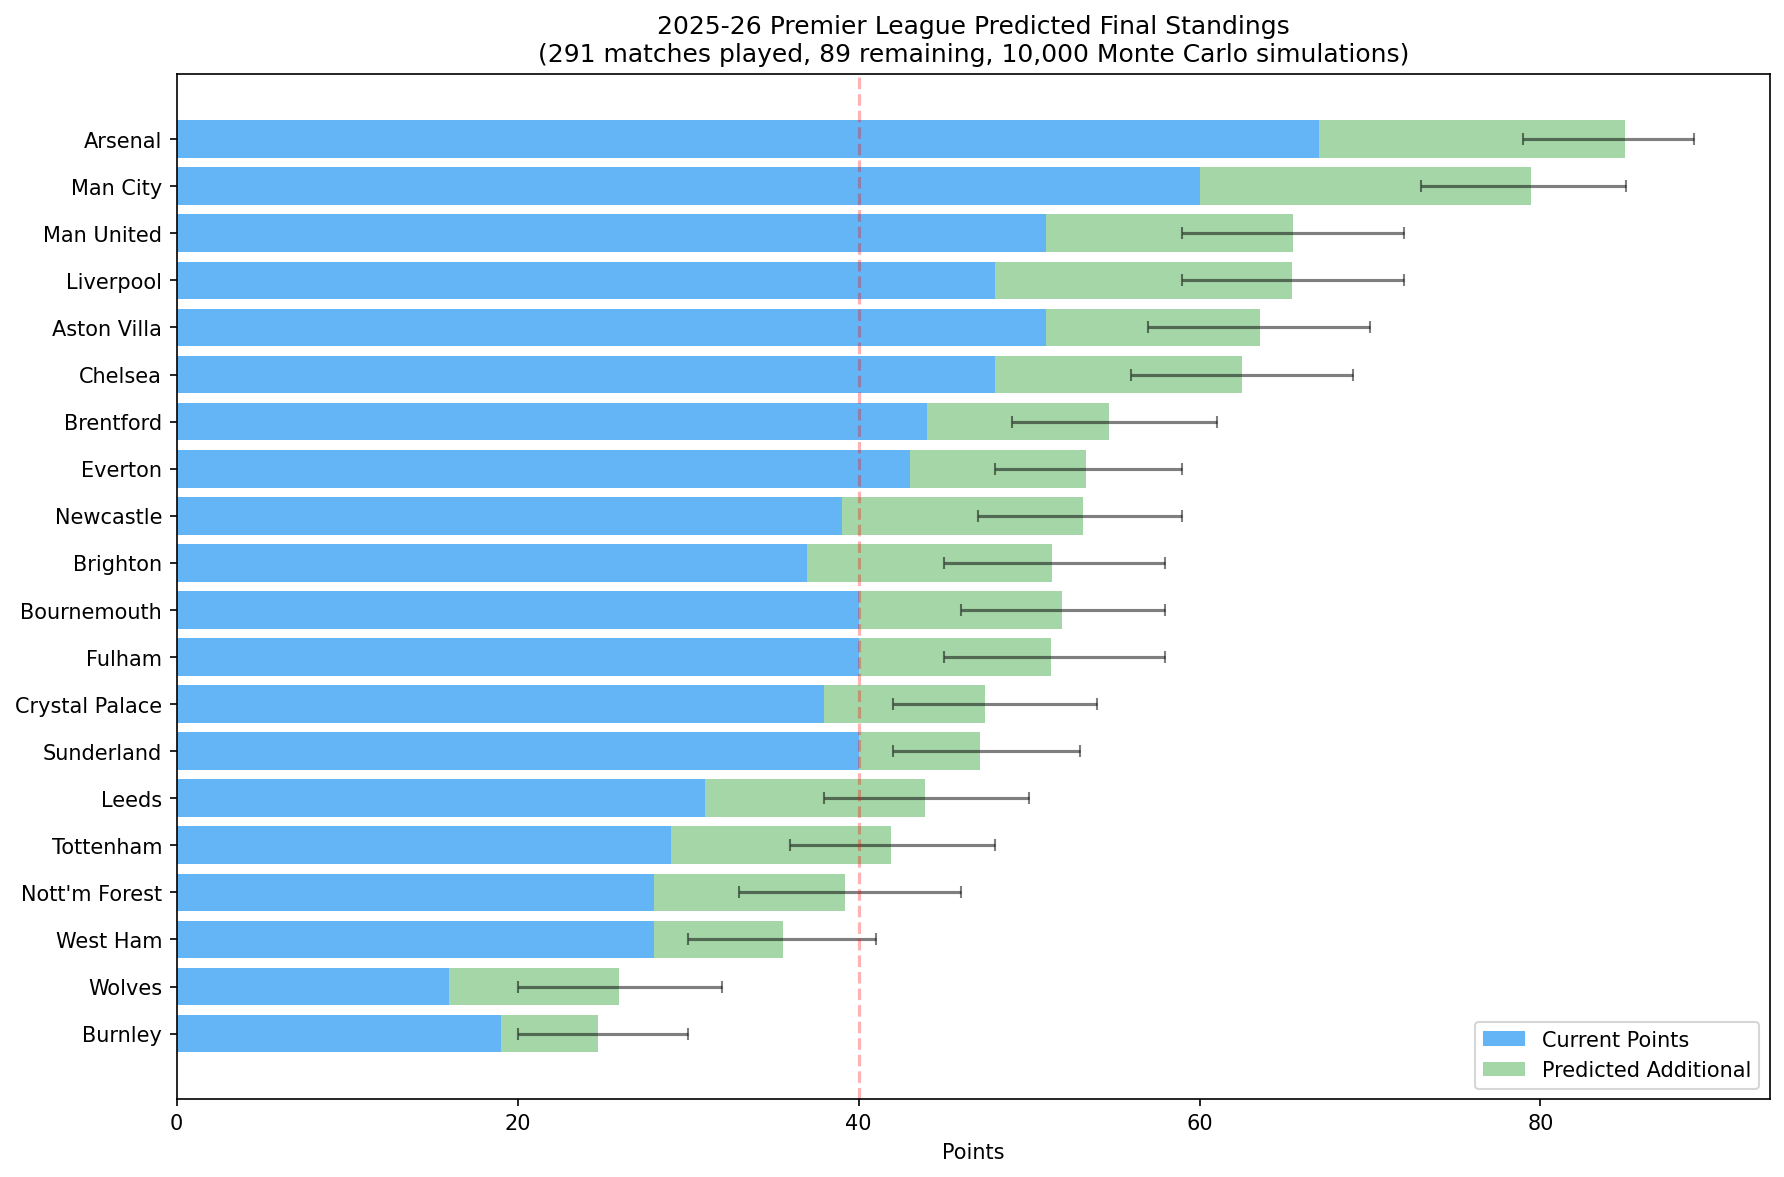
The project extends naturally from match prediction into league table simulation. Using a Dixon-Coles Monte Carlo setup adds a second layer of modelling value beyond single-match probabilities.
# Repository structure at a glance
project_structure = {
    'main.py': 'end-to-end modelling pipeline',
    'src/features.py': 'feature engineering and temporal split logic',
    'src/models.py': 'LR, LightGBM, MLP, calibration, ensembles',
    'src/evaluate.py': 'metrics, calibration, walk-forward tests',
    'src/simulator.py': 'Dixon-Coles Monte Carlo simulation',
    'generate_figures.py': 'report-grade figures',
}

for k, v in project_structure.items():
    print(f'{k}: {v}')
Takeaway
This project is valuable for the portfolio because it shows more than sports modelling. It shows a full analytical pipeline with multi-source data, deliberate feature engineering, realistic temporal validation, model calibration, and simulation-based downstream outputs.
That makes it a good supporting project for analytics engineering and applied modelling roles, even without forcing it to look like a pure data engineering system.